
Tuesday, April 26, 2011

Thursday, April 14, 2011

Monday, April 11, 2011


Sunday, April 10, 2011


Thursday, April 7, 2011
Kürschák's Dodecagon
 A visual proof by Kürschák that a regular 12-sided polygon inscribed in the unit circle has area 3. This means that estimating π to be 3 is like saying a circle is a Dodecagon.

Tuesday, April 5, 2011

Tuesday, March 29, 2011

Tuesday, March 22, 2011
Circle packings

Sunday, March 13, 2011

Wednesday, March 9, 2011


Tuesday, March 8, 2011


The colors represent the amplitude of the ground's horizontal motion 6 seconds into a 4.4-magnitude earthquake. This image produced on a supercomputer in Pittsburgh is one of several such simulations whose accuracy provides architects with localized information on the kind of intensity buildings may have to withstand.
This is one of many beautiful supercomputer simulations compiled by Discover.

Sunday, March 6, 2011

Tuesday, March 1, 2011


Monday, February 28, 2011

A Wada Basin is a naturally occurring fractal that can be constructed using 3 mirrored spheres as above.


Friday, February 18, 2011
Thursday, February 17, 2011


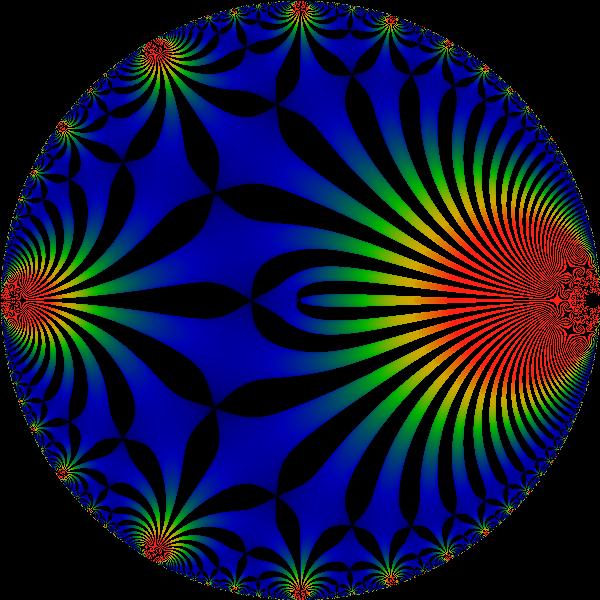
Hyperbolic geometry differs greatly from what we are used to in that the longest path between two points is a straight line. You can think of hyperbolic space like Euclidean space, but with a different way of defining the distance between two points (we call this a metric). Above is the hyperbolic equivalent of an icosidodecahedron. Check out more hyperbolic tilings here.
Sunday, February 13, 2011

Monday, February 7, 2011

Above are hypocycloids, curves produced by fixing a point on the circumference of a small circle of radius b, rolling around the inside of a large circle of radius a > b. If a/b is rational, i.e. it can be expressed as a fraction, the path will return to it's starting point. If the ratio is irrational, the path will never touch the same spot on the circumference of the larger circle more than once, and images such as the ones above result.

Tuesday, February 1, 2011


Einstein Cross: Gravity bends light so that two galaxies look like 5!

Relativity predicts that gravity warps the shape of space and time so that light will no longer move along a straight path. One of the earliest confirmations of the theory was during a total eclipse which allowed us to see a star that wasn't quite in the right place. The sun's gravitational force bent the light rays so that the star appeared about an inch away from where it actually was.
In the image above, the galaxy in the center bends the light waves coming off of the object behind it so that we see 4 different images of the same object. This is called gravitational lensing.
Monday, January 31, 2011

Tuesday, December 28, 2010

"Koch Curve 85degrees: Generalizing the von Koch curve with an angle a chosen between 0 and 90°. The fractal dimension is then

http://en.wikipedia.org/wiki/List_of_fractals_by_Hausdorff_dimension
Sunday, November 21, 2010

Irreducible fractions come up all the time in math problems, but who knew they looked so beautiful all together?
This picture, from Wolfram, is of irreducible fractions in the Complex plane.

These pictures, drawn by a harmonograph, may better be described as pictures of music. A harmonograph is a mechanical device that uses pendulums that move pen and paper simultaneously to create these images. The device was invented by a mathematician in 1844 and apparently was a popular form of entertainment at Victorian soirees.
The images vary depending on how the pendulums swing in relation to one another. Harmonic ratios used in music such as 3:2, 4:3 give the images below.

Subscribe to:
Posts (Atom)